Examples
Single span
Below is an example configuration file for a single span structure.
base_dir: ./ # Base directory where code is being run
output_dir: ./output # Where to save output to
log_level: info # Verbosity used in logging
cores: 2 # Number of cores to use when processing
width: 18 # Width of structure
height: 4 # Height of structure
steps: 1 # Steps to generate nodes
stress_tensile: 1.0 # Tensile stress
stress_compressive: 1.0 # Compressive stress
youngs_modulus: 1.0 # Material stiffness (used for elastic design only)
avg_deflection_limit: -1.0 # Limit on weighted average of loaded points in elastic design.
joint_cost: 0.0 # Joint costs
loaded_points: # Loaded points
  - [0, 4]
  - [2, 4]
  - [4, 4]
  - [6, 4]
  - [8, 4]
  - [10, 4]
  - [12, 4]
  - [14, 4]
  - [16, 4]
  - [18, 4]
load_direction: # Load direction
  - 0.0
  - -1.0
load_large: 3.75 # Large load
load_small: 0.204 # Small load
max_length: 36 # Max length
max_length_initial_ground_structure: 1.5 # Threshold for marking a potential member as active
support_points: # Support points in form [x_coord, y_coord, restrain_x, restrain_y] (true=fixed, false=free for restrain_x/restrain_y)
  - [0, 0, True, True] # Pinned support
  - [18, 0, False, True] # Roller support
member_area_filtering: 0.001 # Fraction of maximum member area for output threshold
cvxpy:
  solver: clarabel # See <https://www.cvxpy.org/tutorial/solvers/index.html?h=solve#choosing-a-solver> for further details
filter_levels: [1.0] # List of values to filter by if empty no filtering is performed
primal_method: load_factor # Primal method
problem_name: spanning_18x4 # Problem name
csv_filename: results.csv # Filename to save results to, if left as `results.csv` will have YYYY-MM-DD-hhmmss added
notes: spanning 18x4 example four load points # Notes to include
plotting:
  run: true # Whether to plot the trusses
  bar_thickness: 0.3 # Bar thickness when plotting
  dpi: 1200 # Dots per inch when plotting
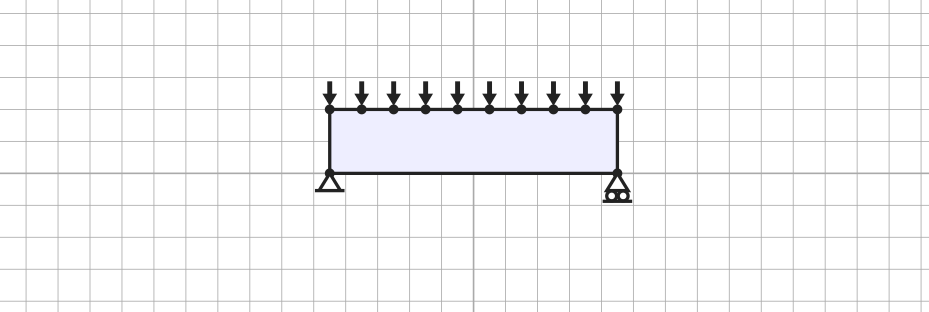
The setup of this example is represented by the following image (produced using the
LayOpt truss layout optimization web tool):
A copy of the above configuration can be downloaded by right-clicking on
single_span_roller_config.yaml and saving it to your working directory (alternatively,
copy and paste the above text into a file called single_span_roller_config.yaml and save it to your working directory).
You can then run this job with:
The output in the terminal should include the following (with a different date & time):
2026-08-04 15:51:55.683 | INFO | layopt.layopt:trussopt:629 - Volume (filter_level = 1.0): 797.5663145501328
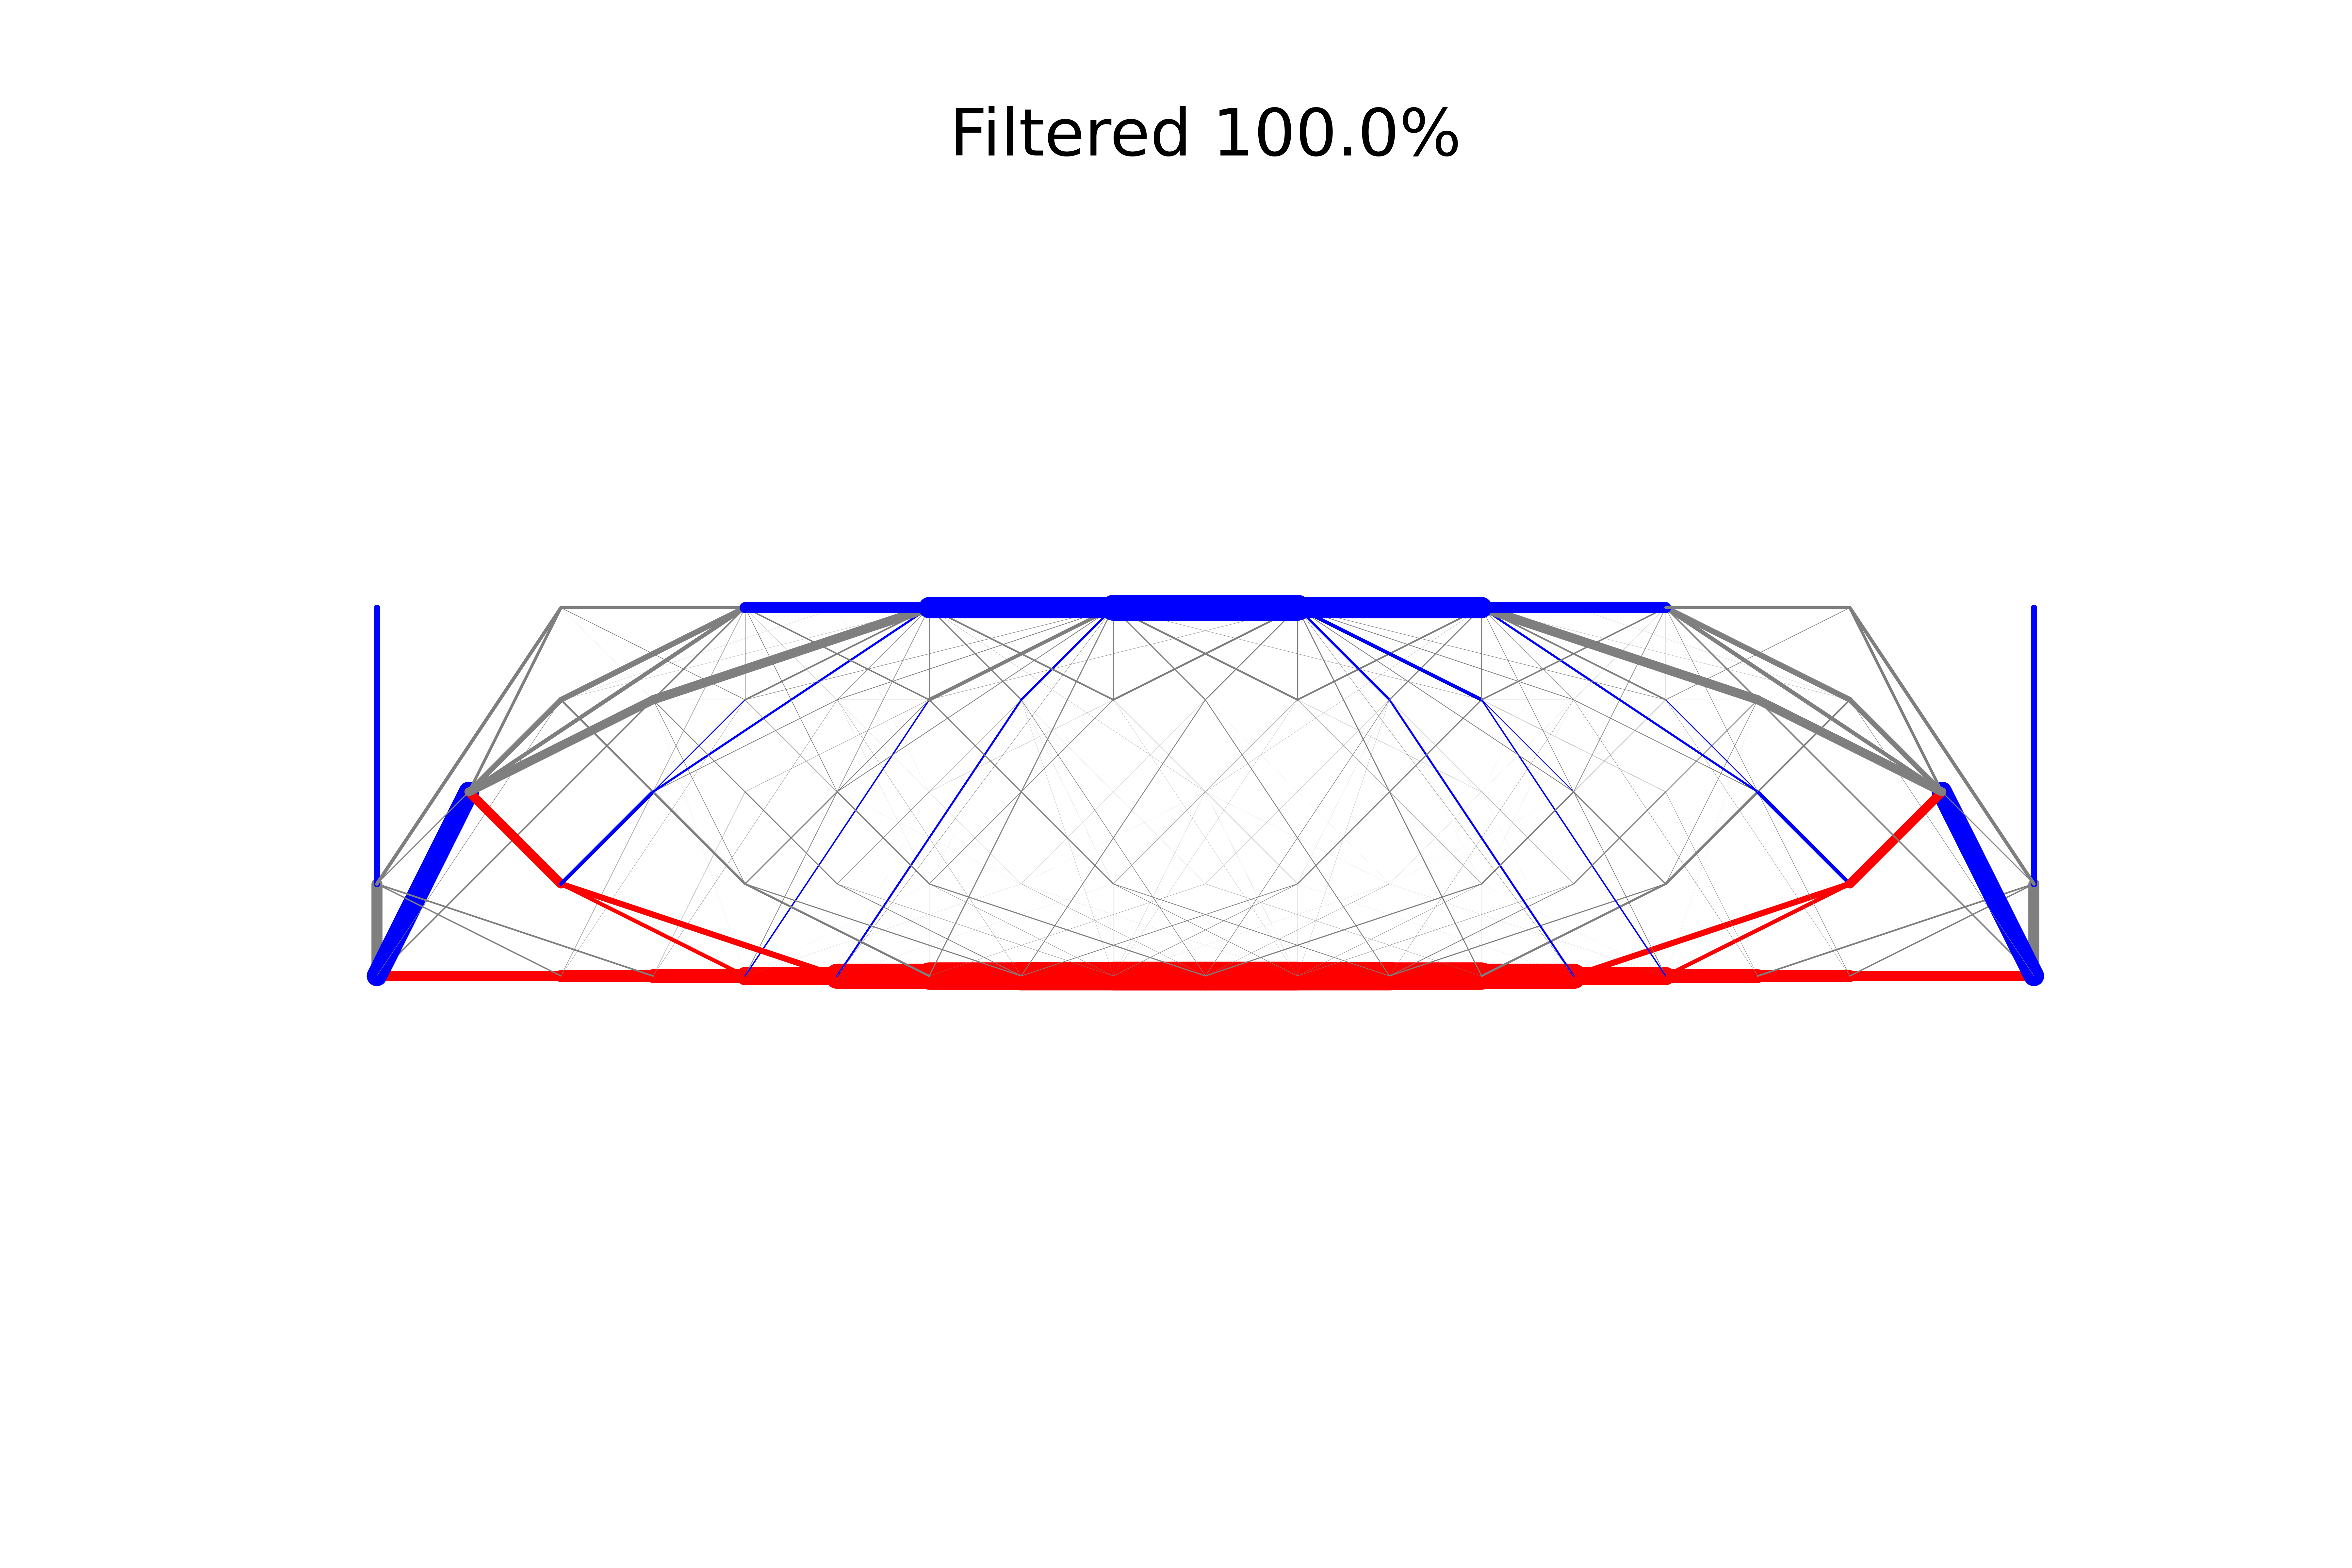
and the output directory will contain the following plot and a CSV file output of results:
Square cantilever
This example is adapted from Subsection 7.2 of Fairclough et al. (2023).
base_dir: ./ # Base directory where code is being run
output_dir: ./output # Where to save output to
log_level: info # Verbosity used in logging
cores: 2 # Number of cores to use when processing
width: 8 # Width of structure
height: 8 # Height of structure
steps: 1 # Steps to generate nodes
stress_tensile: 1.0 # Tensile stress
stress_compressive: 1.0 # Compressive stress
youngs_modulus: 1.0 # Material stiffness (used for elastic design only)
avg_deflection_limit: -1.0 # Limit on weighted average of loaded points in elastic design.
joint_cost: 0.0 # Joint costs
loaded_points: # Loaded points
  - [8, 0]
  - [8, 4]
load_direction: # Load direction
  - 0.0
  - -1.0
load_large: 50 # Large load
load_small: 5 # Small load
max_length: 16 # Max length
max_length_initial_ground_structure: 1.5 # Threshold for marking a potential member as active
support_points: # Support points
  - [0, 0, True, True]
  - [0, 1, True, True]
  - [0, 2, True, True]
  - [0, 3, True, True]
  - [0, 4, True, True]
  - [0, 5, True, True]
  - [0, 6, True, True]
  - [0, 7, True, True]
  - [0, 8, True, True]
member_area_filtering: 0.001 # Fraction of maximum member area for output threshold
cvxpy:
  solver: clarabel # See <https://www.cvxpy.org/tutorial/solvers/index.html?h=solve#choosing-a-solver> for further details
filter_levels: [1.0] # List of values to filter by if empty no filtering is performed
primal_method: load_factor # Primal method
problem_name: square_cantilever # Problem name
csv_filename: results.csv # Filename to save results to, if left as `results.csv` will have YYYY-MM-DD-hhmmss added
notes: square cantilever three load points # Notes to include
plotting:
  run: true # Whether to plot the trusses
  bar_thickness: 0.3 # Bar thickness when plotting
  dpi: 1200 # Dots per inch when plotting
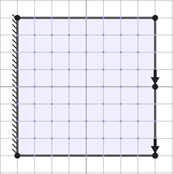
The setup of this example is represented by the following image (produced using the LayOpt truss layout optimization web tool):
A copy of the above configuration can be downloaded by right-clicking on
square_cantilever_config.yaml and saving it to your working directory
(alternatively, copy and paste the above text into a file called square_cantilevel_config.yaml and save it to
your working directory). You can then run this job with:
The output in the terminal should include the following (with a different date & time):
2026-06-26 16:17:32.151 | INFO | layopt.layopt:trussopt:894 - Volume (filter_level = 1.0): 2070.3703705771877
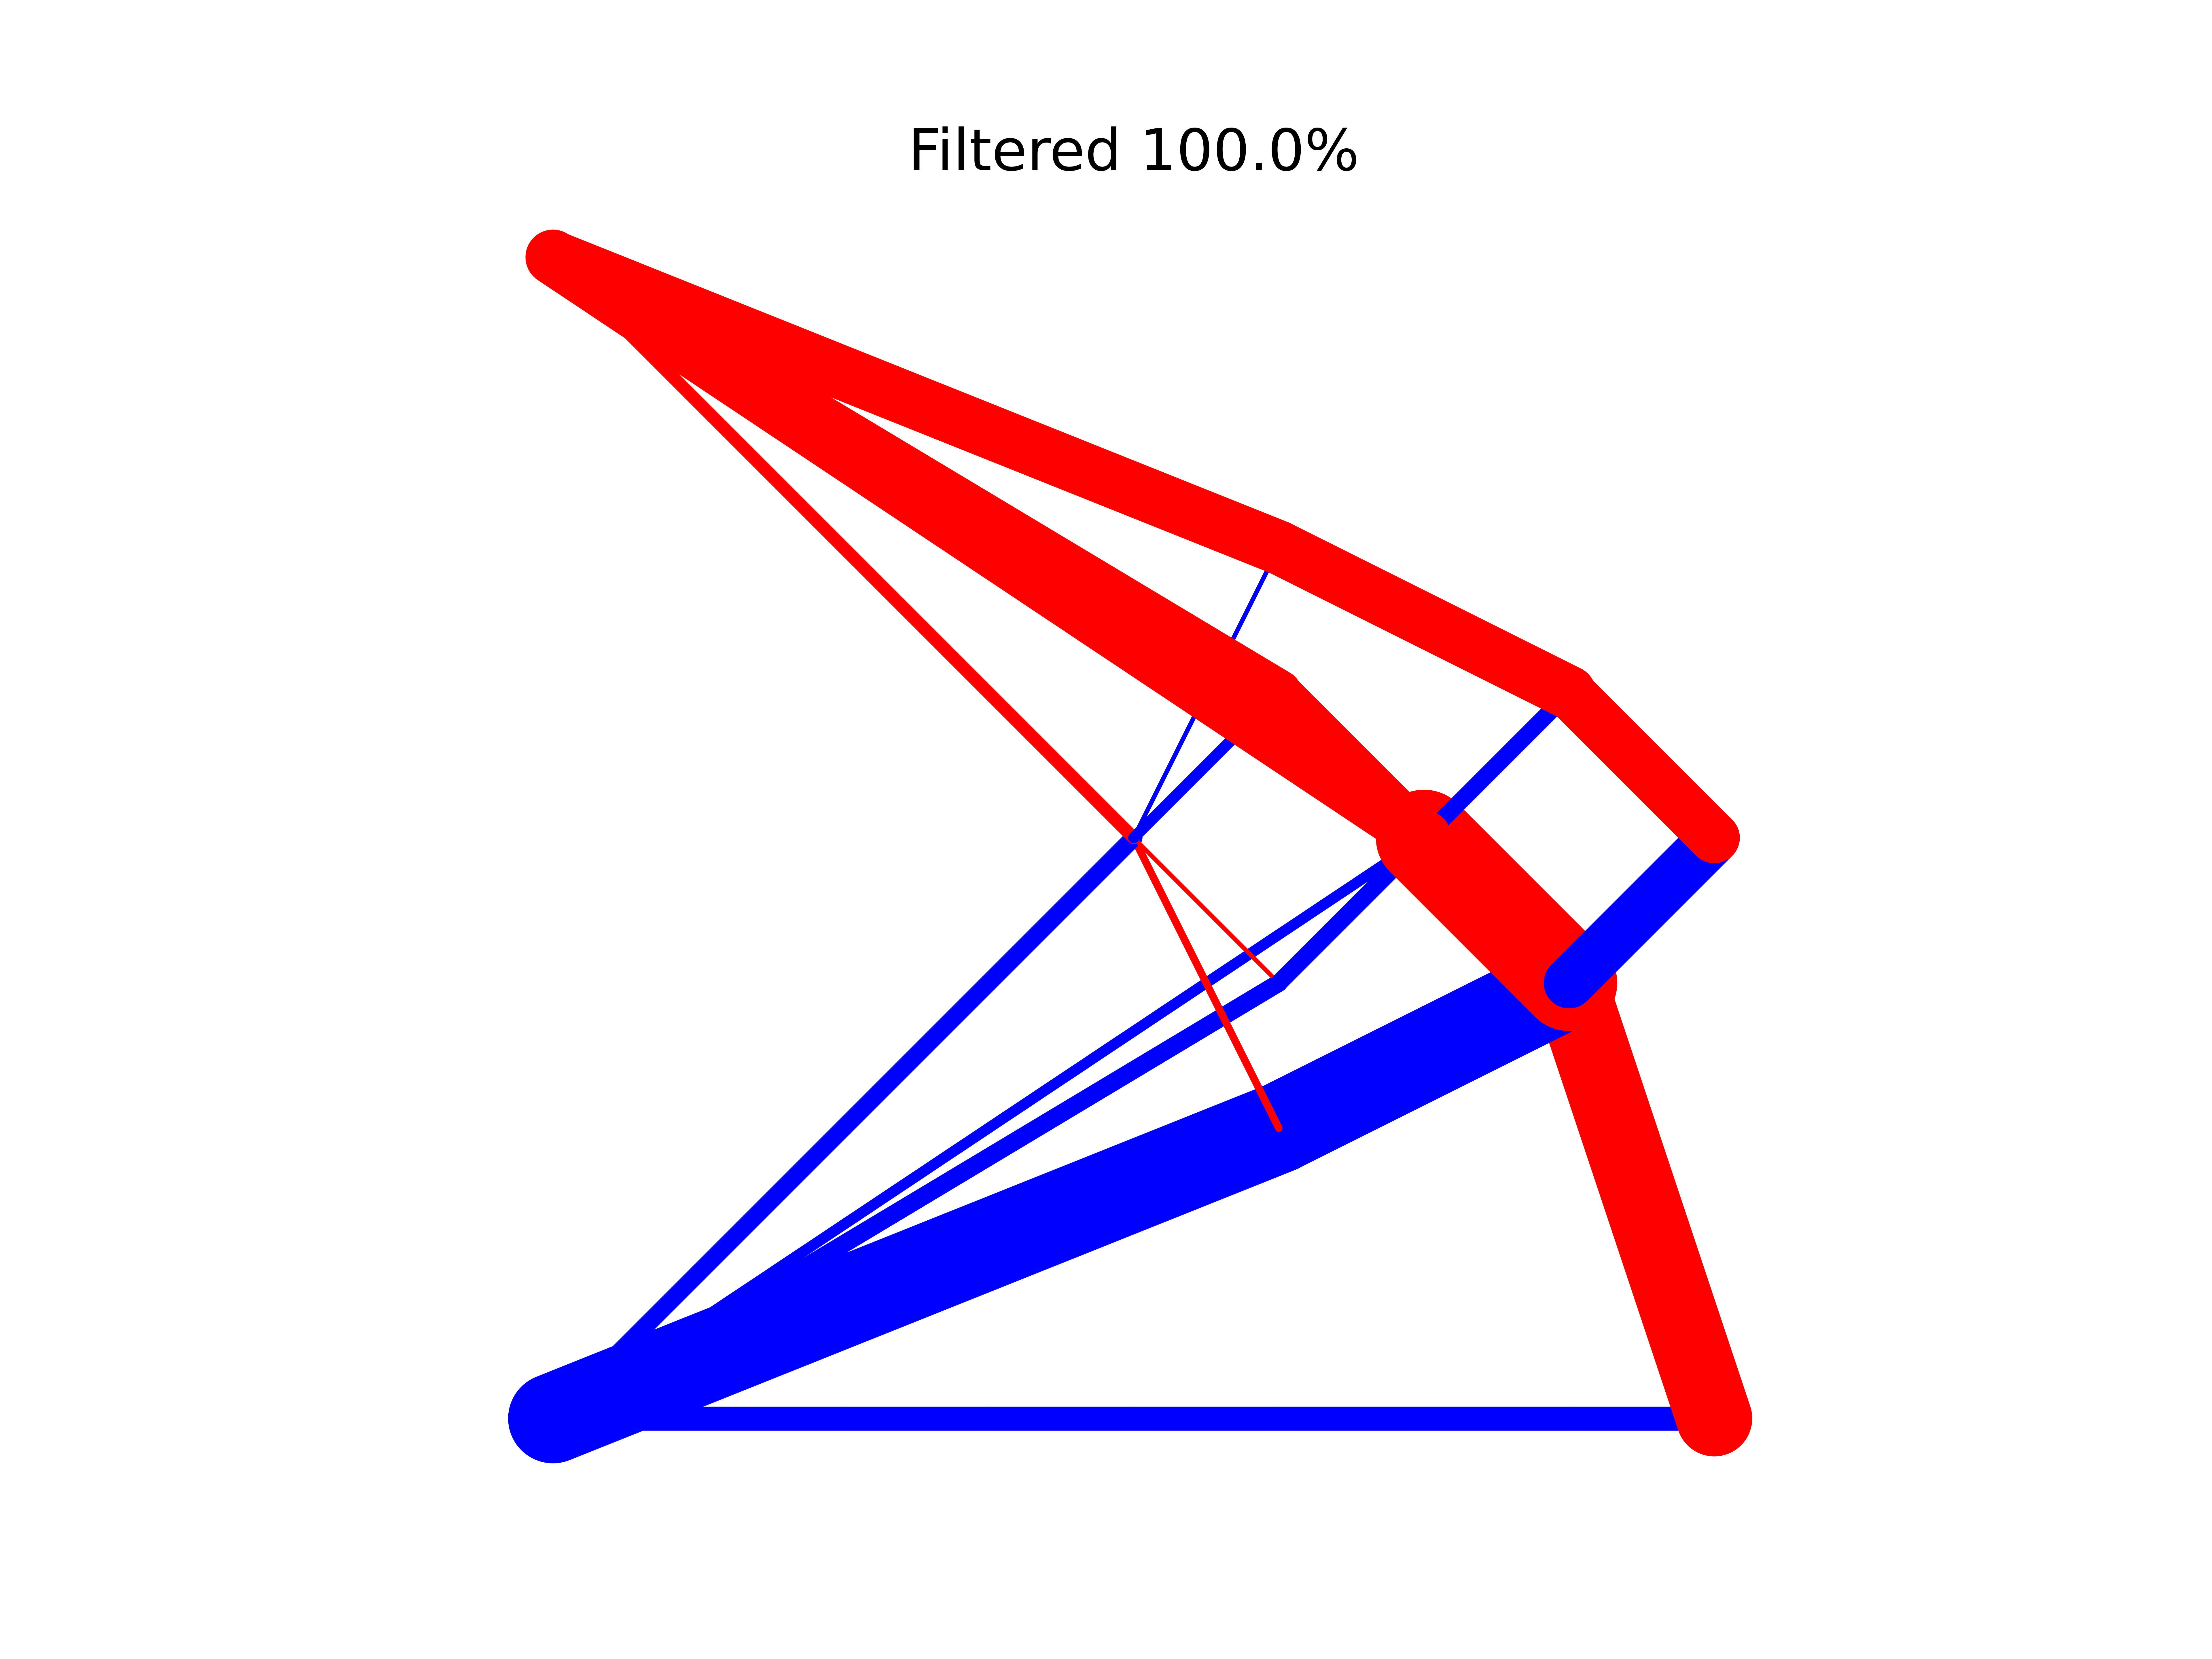
and the output directory will contain the following plot and a CSV file output of results: